The Suntory Group has brought together its performance for the main indicators (management, environment, and society) on our sustainabilitysite and other media.
Actual results marked with ★ have received independent assurance by KPMG AZSA Sustainability Co., Ltd. In accordance with International Standard on Assurance Engagement (ISAE) 3000 and ISAE 3410.
Key Financial Data
Consolidated financial Results
-
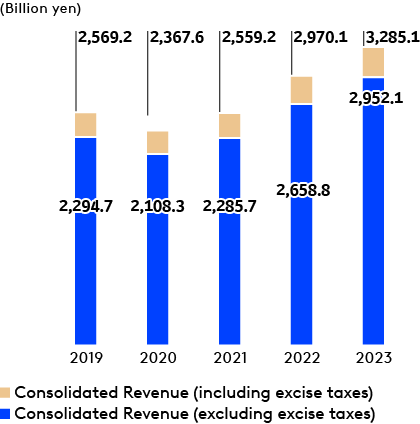
Consolidated Revenue
-
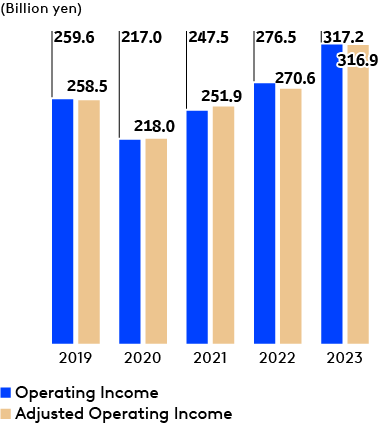
Consolidated Operating Income
-
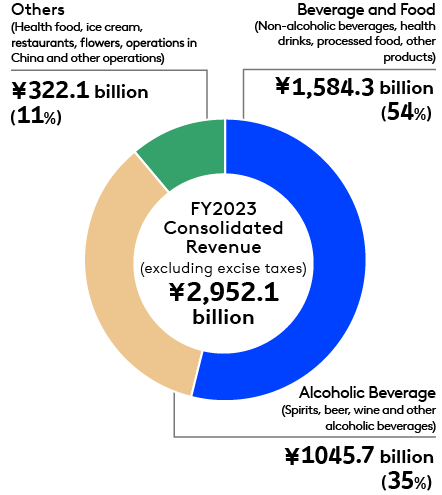
Sales by Business Segment
-
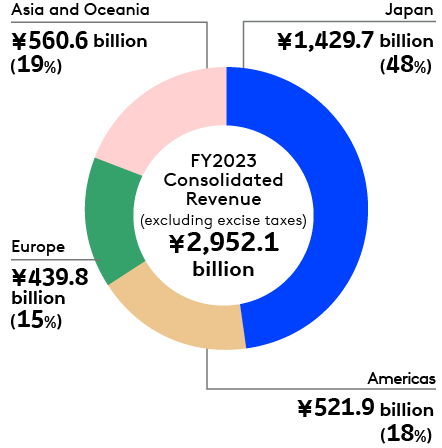
Sales by Area
Economic contribution*
| Economic contribution | Revenues | 2,952.1 |
| Operating costs | 1,018.7 | |
| Employee wages and benefits | 453.6 | |
| Payments to providers of capital | 70.8 | |
| Payments to government | 83.3 | |
| Community investment | 7.3 | |
| Financial assistance from government | - | |
| Financial investment contribution | ||
| Capex - depreciation | 66.4 | |
| Share buybacks plus dividend payments | 44.2 | |
| Total R&D expenses | 29.8 | |
| Total global tax | 83.3 | |
-
*Disclose based on the core metrics of Measuring Stakeholder Capitalism-Toward Common Metrics and Consistent Reporting of Sustainable Value Creation, as recommended by the World Economic Forum's International Business Council.
Environmental Data
Targets and Progress<Water>
| 2030 | 2023 |
|---|---|
| Reduction of water used in direct operation Reduce the water intensity of production at our owned plants*1 by 35%*2 globally. In addition, explore reduction of absolute amount of water withdrawn in highly water stressed areas |
Reduced the water intensity of production by 28% compared to 2015. |
| Water replenishment Replenish more than 100% of water used in at least 50% of our owned plants*1 globally, including all those in highly water stressed areas, through local water source conservation efforts. |
Water resource cultivation activities implemented in 41% of all owned plants globally. For the plants located in highly water stressed areas, activities are implemented in 37% of those areas. |
| Sustainable water use in raw ingredients Collaborate with suppliers to improve water-use efficiency in the production of water-intensive key ingredients*3 in highly water stressed areas. |
|
| Water education and access to safe water Expand water education programs and initiatives to provide safe water access for more than 1 million people. |
Total 1,070,000 people Water education program: 710,000 people Provision of safe water: 360,000 people |
-
*1Suntory Group plants that manufactures finished products
-
*2Reduction per unit production based on the business fields in 2015
-
*3Coffee, barley, grapes
Water Use Performance
| Area | Water use (thousand m3) | ||||
|---|---|---|---|---|---|
| 2015 (base year) |
2020 | 2021 | 2022 | 2023 | |
| Japan | 21,816 | 20,752 | 20,461 | 21,230 | To be updated at the end of July |
| Americas | 8,132 | 6,737 | 6,253 | 4,919 | |
| Europe | 6,473 | 5,454 | 5,985 | 6,270 | |
| Asia | 4,492 | 6,364 | 6,212 | 6,761 | |
| Oceania | 562 | 444 | 424 | 397 | |
| Africa | 216 | 89 | 84 | - | |
| Total | 41,692 | 39,840 | 39,419 | 39,576★ | |
-
*2015 (base year): Data covers 25 production plants in Japan and 59 production plants overseas *2022:Data covers 27 production plants in Japan and 62 production plants overseas
-
*Therein, the water use by Suntory Beverage & Food Group in Japan and overseas was 22,916 thousand m3★
-
*Results have received independent assurance from KPMG AZSA Sustainability Co., Ltd. The assured numerical values are indicated with ★.
Trends in Water use and Water intensity of Production (Results for 2023 to be updated at the end of July)
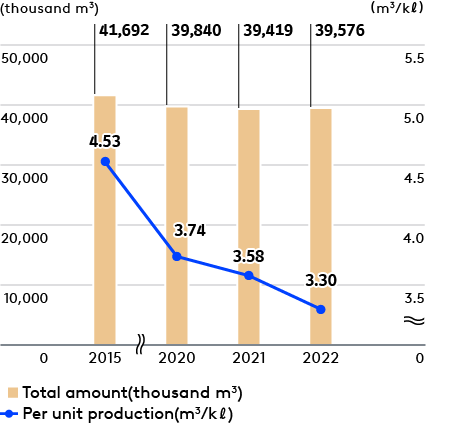
-
*Per unit production is the amount of usage per kiloliter produced
-
*2022 data covers 27 production plants in Japan and 62 production plants overseas.
Amount of water usage by water source
| Intake source | Amount of water (thousand m3) | |||
|---|---|---|---|---|
| 2020 | 2021 | 2022 | 2023 | |
| Groundwater | 17,698 | 17,129 | 17,520 | To be updated at the end of July |
| Rivers/lakes | 6,097 | 5,565 | 3,986 | |
| Rain water | 0 | 0 | 0 | |
| City water | 16,045 | 16,725 | 18,070 | |
| Water supplied from external sources (recycled water) | 0 | 0 | 0 | |
| Total | 39,840 | 39,419 | 39,576★ | |
-
*Data covers 27 production plants in Japan and 62 production plants overseas
-
*Industrial water was reclassified from Rivers/lakes to City water, resulting in the restatement of the breakdown for 2020 and 2021.
-
*Results have received independent assurance from KPMG AZSA Sustainability Co., Ltd. The assured numerical values are indicated with ★.
Water discharge
| Destination | Waste Water (thousand m3) | |||
|---|---|---|---|---|
| 2020 | 2021 | 2022 | 2023 | |
| Rivers/lakes | 13,611 | 14,204 | 14,283 | To be updated at the end of July |
| Sea | 967 | 1,088 | 1,086 | |
| Sewers | 8,283 | 8,614 | 8,599 | |
| Others (for watering plants, etc.) | 55 | 113 | 124 | |
| Total | 22,917 | 24,019 | 24,092★ | |
-
*Data covers 27 production plants in Japan and 62 production plants overseas
-
*Results have received independent assurance from KPMG AZSA Sustainability Co., Ltd. The assured numerical values are indicated with ★.
Number of participants in the Suntory Mizuiku
| Area | 2020 | 2021 | 2022 | 2023 |
|---|---|---|---|---|
| Japan | 9,800 | 22,100 | 24,600 | To be updated at the end of July |
| Vietnam | 14,100 | 44,700 | 61,100 | |
| Thailand | 4,100 | 6,600 | 3,700 | |
| France | 100 | 400 | 300 | |
| China | - | 4,000 | 18,700 | |
| Spain | - | - | 400 | |
| United Kingdom (Starts in 2023) | - | - | - | |
| New Zealand (Starts in 2023) | - | - | - |
-
*The number of participants includes children, parents, teachers, and expert instructors.
Targets and Progress<GHG>
| 2030年 | 2023年 |
|---|---|
| Reduce GHG emissions from our direct operations by 50%*1 | 24% reduction compared to 2019 |
| Reduce GHG emissions across our entire value chain by 30%*1 | To be updated at the end of July*2 |
-
*1Based on emissions in 2019.
-
*2(Reference) 2022 Progress
Direct operations: 16.9% reduction
Entire value chain: 3.5% reduction
Scope 1 and 2 Emissions
| Area | Scope | GHG emissions (Scope1 : thousand tons CO2e, Scope2 : thousand tons CO2) |
|||||
|---|---|---|---|---|---|---|---|
| 2019 | 2020 | 2021 | 2022 | 2023 | |||
| Japan | Scope 1 | 250 | 248 | 246 | 233 | To be updated at the end of July |
|
| Scope 2 | 183 | 169 | 172 | 58 | |||
| Scope 1+2 | 433 | 417 | 418 | 292 | |||
| Americas | Scope 1 | 162 | 149 | 179 | 209 | ||
| Scope 2 | 63 | 19 | 13 | 10 | |||
| Scope 1+2 | 225 | 168 | 192 | 220 | |||
| Europe | Scope 1 | 108 | 98 | 107 | 91 | ||
| Scope 2 | 17 | 1 | 1 | 0 | |||
| Scope 1+2 | 125 | 98 | 108 | 91 | |||
| Asia | Scope 1 | 51 | 45 | 50 | 55 | ||
| Scope 2 | 153 | 131 | 155 | 179 | |||
| Scope 1+2 | 204 | 176 | 206 | 234 | |||
| Oceania | Scope 1 | 11 | 9 | 9 | 6 | ||
| Scope 2 | 7 | 4 | 4 | 1 | |||
| Scope 1+2 | 19 | 13 | 13 | 7 | |||
| Africa | Scope 1 | 7 | 6 | 8 | - | ||
| Scope 2 | 1 | 0 | 0 | - | |||
| Scope 1+2 | 8 | 6 | 8 | - | |||
| Total | Scope 1 | 590 | 555 | 599 | 594 | ||
| Scope 2 | 424 | 324 | 345 | 248 | |||
| Scope 1+2 | 1,014 | 879 | 944 | 843 | |||
-
*Data covers GHG emissions for the entire Suntory Group are calculated.
Out of 843 thousand t-CO2e in the table above, Scopes 1 and 2 emissions of 796 thousand t-CO2e★ (Scope 1: 549 thousand t-CO2e★, Scope 2: 247 thousand t-CO2★) have been externally assured, which do not include emissions of GHG other than CO2 at overseas production plants and CO2 emissions at non-production sites outside of Japan. The reporting boundary for the figures externally assured is as follows:
27 production plants in Japan, 62 production plants overseas, and non-production sites in Japan (offices such as main office, training sites, R&D facilities, sales sites, restaurants and development sites) -
*Out of 843 thousand t-CO2e in the table above, the Suntory Beverage and Foods Group's Scopes 1 and 2 emissions of 473 thousand t-CO2e★ (Scope 1: 214 thousand t-CO2e★, Scope 2: 212 thousand t-CO2★) have been externally assured, which do not include emissions of GHG other than CO2 at overseas production plants and CO2 emissions at non-production sites outside of Japan. The reporting boundary for the figures externally assured is as follows:
10 production plants in Japan, 38 production plants overseas, and non-production sites in Japan (offices such as main office, training sites, R&D facilities, sales sites, restaurants and development sites) -
*Results have received independent assurance from KPMG AZSA Sustainability Co., Ltd. The assured numerical values are indicated with ★.
-
*Emission factors for GHG calculation are as follows:
Fuel:
For Japan: Factors specified by the Act on the Rational Use of Energy and the Act on Promotion of Global Warming Countermeasures.
For overseas: Factors obtained from fuel suppliers or factors specified by the Act on the Rational Use of Energy and the Act on Promotion of Global Warming Countermeasures.GHG from Electricity consumption:
For Japan: The adjusted emission factors for each electric power company specified by the Act on Promotion of Global Warming Countermeasures.
For overseas: Factors obtained from individual power suppliers or IEA emission factors by country.GHG other than CO2:
For 27 plants in Japan: Factors specified by the Act on Promotion of Global Warming Countermeasures -
*The total may not match the sum of each figure due to rounding.
Energy Consumption
| 2020 | 2021 | 2022 | 2023 | |
|---|---|---|---|---|
| Energy Consumption | 3,697,891 | 4,019,785 | 4,173,252 | To be updated at the end of July |
| Renewable Energy Consumption(MWh) |
226,864 | 416,234 | 787,831 | |
| Energy Intensity(MWh/KL) | 0.35 | 0.37 | 0.35 |
Scope 3 Emissions (Results for 2023 to be updated at the end of July)
Suntory Group (Results for 2022)
| Category | Emissions (thousand tons CO2e) |
Calculation Method |
|---|---|---|
| 1. Purchased goods and services | 4,759★ | [Raw Materials and Packages] Calculated by multiplying the weight of raw materials and packaging materials purchased for products manufactured and sold by the beverage and food business, alcoholic beverage business, and health food business of the Suntory Group (in Japan and overseas) by the emission factors. 45% of Category 1 GHG emissions are calculated using emission factors calculated from the GHG emissions of suppliers of raw materials and packaging materials. [Contract manufacturers] Calculated by multiplying the volume of the products that Suntory Group (in Japan) , Beam Suntory, Suntory Beverage & Food Europe, and Frucor Suntory Group have outsourced to contract manufacturers by the emission factors. |
| 2. Capital Goods | 530★ | Calculated by multiplying the amount of capital expenditure excluding land expenditure of Suntory Group by emission factors. |
| 3. Fuel and energy-related activities not included in Scope 1 or 2 | 136 | Calculated by multiplying the amount of energy consumed by Suntory Group by emission factors. |
| 4. Upstream transportation and distribution | 433 | Calculated by multiplying the transportation volume in tons-km of goods owned by Suntory Group by emission factors. |
| 5. Waste generated in operations | 7 | Calculated by multiplying the weight of waste disposed by Suntory Group by emission factors. |
| 6. Business travel | 10 | Calculated by multiplying the amount of business travel expenses of Suntory Group by emission factors. |
| 7. Employee commuting | 45 | Calculated by multiplying the amount of commuting expenses of Suntory Group by emission factors. |
| 8. Upstream leased assets | 40 | Calculated by multiplying the storage volume as well as the floor area of distribution centers rented by Suntory Group by emission factors. |
| 9. Downstream transportation and distribution | 248 | Calculated by multiplying the transportation volume in tons-km of Suntory Group by emission factors. |
| 10. Processing of sold products | ― | None |
| 11. Use of sold products | 76 | Calculated by multiplying the sales volume of goods of Suntory Group by emission factors. |
| 12. End-of-life treatment of sold products | 481★ | Calculated by multiplying the weight of packaging materials purchased by the Suntory Group by emission factors. |
| 13. Downstream leased assets | 348★ | Calculated by multiplying the electricity used by leased assets of Suntory Group (In Japan) by emission factors. |
| 14. Franchises | 17 | Calculated as Scopes 1 and 2 CO2 emissions from the direct operations of companies and stores franchised by the Suntory group. |
| 15. Investments | ― | None |
| Total | 7,128★ |
-
*The Suntory Group's beverage and food, alcoholic beverages, and health food businesses in Japan and overseas are included in the scope. For some overseas group companies, emissions were estimated by using Japan-based emission factors or production volume in Japan.
-
*Emission factors used to calculate emissions for Japan include the following:
a) "Emission factor database for corporate GHG emissions accounting over the supply chain (Version 3.2)" (March 2022, Japan's Ministry of the Environment)
b) "LCI Database IDEA Version 2.3" (Advanced LCA Research Group, The National Institute of Advanced Industrial Science and Technology and Sustainable Management Promotion Organization) -
*Results have received independent assurance from KPMG AZSA Sustainability Co., Ltd. The assured value is indicated with ★.
Suntory Beverage & Food Ltd. (Results for 2022)
| Category | Emissions (thousand tons CO2e) |
Calculation Method |
|---|---|---|
| 1. Purchased goods and services | 3,487★ | [Raw Materials and Packages] Calculated by multiplying the weight of raw materials and packaging materials purchased for products manufactured and sold by the Suntory Beverage & Food Group (in Japan and overseas) by the emission factors. 40% of Category 1 GHG emissions are calculated using emission factors calculated from the GHG emissions of suppliers of raw materials and packaging materials. [Contract manufacturers] Calculated by multiplying the volume of the products that Suntory Beverage & Food Group (in Japan) , Suntory Beverage & Food Europe, and Frucor Suntory Group have outsourced to contract manufacturers by the emission factors. |
| 2. Capital Goods | 145★ | Calculated by multiplying the amount of capital expenditure excluding land expenditure of Suntory Beverage & Food Group by emission factors. |
| 3. Fuel and energy-related activities not included in Scope 1 or 2 | 68 | Calculated by multiplying the amount of energy consumed by Suntory Beverage & Food Group by corresponding emission factors. |
| 4. Upstream transportation and distribution | 271 | Calculated by multiplying the transportation volume in tons-km of goods owned by Suntory Beverage & Food Group by corresponding emission factors. |
| 5. Waste generated in operations | 4 | Calculated by multiplying the weight of waste disposed by Suntory Beverage & Food Group by corresponding emission factors. |
| 6. Business travel | 7 | Calculated by multiplying the amount of business travel expenses of Suntory Beverage & Food Group by corresponding emission factors. |
| 7. Employee commuting | 29 | Calculated by multiplying the amount of commuting expenses of Suntory Beverage & Food Group by corresponding emission factors. |
| 8. Upstream leased assets | 32 | Calculated by multiplying the storage volume as well as the floor area of distribution centers rented by Suntory Beverage & Food Group by emission factors. |
| 9. Downstream transportation and distribution | 199 | Calculated by multiplying the transportation volume in tons-km and sales volume of goods of Suntory Beverage & Food Group by corresponding emission factors. |
| 10. Processing of sold products | ― | None |
| 11. Use of sold products | 61 | Calculated by multiplying the sales volume of goods of Suntory Beverage & Food Group by corresponding emission factors. |
| 12. End-of-life treatment of sold products | 365★ | Calculated by multiplying the weight of packaging materials purchased by the Suntory Beverage & Food Group by emission factors. |
| 13. Downstream leased assets | 317★ | Calculated by multiplying the electricity used by leased assets of Suntory Beverage & Food Group (In Japan) by emission factors. |
| 14. Franchises | 9 | Calculated as Scopes 1 and 2 CO2 emissions from the direct operations of companies and stores franchised by the Suntory Beverage & Food Group. |
| 15. Investments | ― | None |
| Total | 4,994★ |
-
*The Suntory Beverage & Food Group's beverage and food businesses in Japan and overseas are included in the scope. For some overseas group companies, emissions were estimated by using Japan-based emission factors or production volume in Japan.
-
*Emission factors used to calculate emissions for Japan include the following:
a) "Emission factor database for corporate GHG emissions accounting over the supply chain (Version 3.2)" (March 2022, Japan's Ministry of the Environment)
b) "LCI Database IDEA Version 2.3" (Advanced LCA Research Group, The National Institute of Advanced Industrial Science and Technology and Sustainable Management Promotion Organization) -
*Results have received independent assurance from KPMG AZSA Sustainability Co., Ltd. The assured value is indicated with ★.
SOx emissions
| 2020 | 2021 | 2022 | 2023 | |
|---|---|---|---|---|
| Emissions (t) | 10.4 | 3.4 | 2.1 | To be updated at the end of July |
| Per Unit (g/kL) | 2.2 | 0.7 | 0.4 |
-
*27 production plants in Japan
NOx emissions
| 2020 | 2021 | 2022 | 2023 | |
|---|---|---|---|---|
| Emissions (t) | 151.6 | 141.8 | 108.1 | To be updated at the end of July |
| Per Unit (g/kL) | 32.2 | 29.8 | 21.1 |
-
*27 production plants in Japan
By-products and Waste Generation Performance
| Area | Amount of discharge (thousand tons) | |||
|---|---|---|---|---|
| 2020 | 2021 | 2022 | 2023 | |
| Japan | 228 | 218 | 230 | To be updated at the end of July |
| Americas | 156 | 410 | 541 | |
| Europe | 95 | 119 | 144 | |
| Asia | 32 | 30 | 54 | |
| Oceania | 7 | 7 | 6 | |
| Africa | 0 | 0 | - | |
| Total | 518 | 783 | 975★ | |
-
*Data covers 27 production plants in Japan and 62 production plants overseas
-
*The increase in emissions for Americas is due to the expansion of waste and by-products that should be included from FY2021. The amount of the waste and by-products increased by 144 thousand tons for this reason.
-
*The increase in emissions for Asia is due to the expansion of waste and by-products that should be included from FY2022. The amount of the waste and by-products increased by 15 thousand tons for this reason.
-
*Therein, the byproducts and waste generated by Suntory Beverage & Food Group in Japan and overseas amount to 184 thousand tons★
-
*Results have received independent assurance from KPMG AZSA Sustainability Co., Ltd. The assured numerical values are indicated with ★.
Recycling Rate of Japanese Plants and Flow for reuse of by-products and waste generated in each production process
| 2020 | 2021 | 2022 | 2024 | |
|---|---|---|---|---|
| Amount of discharge (thousand ton) | 228 | 218 | 230 | To be updated at the end of July |
| Amount recycled (thousand ton) | 228 | 217 | 230 | |
| recycling rate (%) | 100.0 | 99.7 | 100.0 |
By-products and Waste generation, recycling rate and the purpose of use for recycled products
| Type of waste | Main Purpose of Use | 2020 | 2021 | 2022 | 2023 | ||||
|---|---|---|---|---|---|---|---|---|---|
| Generation (t) | Recycling Rate (%) | Generation (t) | Recycling Rate (%) | Generation (t) | Recycling Rate (%) | Generation (t) | Recycling Rate (%) | ||
| Vegetable (glycation, tea, coffee dregs, etc.) | - Animal feed - Fertilizer |
164,185 | 100 | 158,823 | 100 | 167,855 | 100 | To be updated at the end of July |
|
| Sludge (excess sludge, etc.) | - Fertilizer | 30,275 | 100 | 27,337 | 100 | 28,396 | 100 | ||
| Wood waste (cask, palletes) | - Animal feed - Fertilizer |
5,186 | 100 | 5,267 | 100 | 3,658 | 100 | ||
| Glass and ceramic scrap | - Glass materials - Base course material |
2,285 | 100 | 1,337 | 100 | 1,172 | 100 | ||
| Paper scraps (cardboards, paper labels, etc.) | - Recycled paper - Cardboard materials |
5,520 | 100 | 5,398 | 100 | 5,735 | 100 | ||
| Plastic | - Palette - Solid fuel - Supplementary fuel |
6,033 | 100 | 5,796 | 100 | 5,810 | 100 | ||
| Metal scraps (aluminum, steel) | - Aluminum - Steel ingredients |
3,314 | 100 | 3,506 | 100 | 3,123 | 100 | ||
| Other | 11,558 | 100 | 9,731 | 100 | 13,979 | 100 | |||
| Total | 228,355 | 100 | 217,925 | 100 | 229,728 | 100.0 | |||
-
*Data covers 27 production plants in Japan
Suntory Group's Environmental Accounting (total of business in Japan)
(Period: January 1 to December 31, 2022)
| Item | FY2020 | FY2021 | FY2022 | FY2023 | ||||||
|---|---|---|---|---|---|---|---|---|---|---|
| Environmental investment | Environmental costs | Environmental investment | Environmental costs | Environmental investment | Environmental costs | Environmental investment | Environmental costs | |||
| Business area cost | Pollution prevention cost |
|
735 | 2,082 | 530 | 2,070 | 662 | 2,280 | To be updated at the end of July |
|
| Global environmental preservation cost |
|
428 | 2,730 | 651 | 2,843 | 956 | 3,100 | |||
| Resource circulation cost |
|
153 | 3,413 | 66 | 4,027 | 21 | 3,650 | |||
| Total | 1,315 | 8,225 | 1,247 | 8,940 | 1,639 | 9,030 | ||||
| Upstream and downstream cost |
|
0 | 1,187 | 0 | 1,387 | 0 | 1,386 | |||
| Management activities costs |
|
0 | 714 | 0 | 921 | 0 | 768 | |||
| Research and development costs |
|
9 | 324 | 3 | 317 | 35 | 284 | |||
| Social activities costs |
|
70 | 503 | 47 | 514 | 75 | 629 | |||
| Environmental damage response cost | 0 | 0 | 0 | 0 | 0 | 0 | ||||
| Total | 1,394 | 10,953 | 1,298 | 12,080 | 1,748 | 12,097 | ||||
-
*Amount of investment: Reason for investment was 50% or more for preserving the environment, all amount is considered as environmental investment (inspection basis)
-
*Amortization expense: Expenses for investment from 2003 and afterwards which 50% or more is intended for environmental preservation are calculated.
-
*In general, all cost for management and research activities are directly confirmed. Costs that are difficult to confirm directly are prorated and allocated based on a past survey of each procedure.
Environmental Preservation Effect of Suntory Group (production sites in Japan)
(Period: January 1 to December 31, 2022)
| Item | Unit | 2020 | 2021 | 2022 | 2023 | Reduction against previous fiscal year per unit production basis | |||
|---|---|---|---|---|---|---|---|---|---|
| In business area costs | Pollution prevention | Reduction of pollutant emissions | SOx | Total (t) | 10.4 | 3.4 | 2.1 | To be updated at the end of July |
1.5 |
| Per Unit (g/kL) | 2.2 | 0.7 | 0.4 | ||||||
| NOx | Total (t) | 152.3 | 141.8 | 108.1 | 44.3 | ||||
| Per Unit (g/kL) | 32.4 | 29.4 | 21.1 | ||||||
| Preserving global environment | GHG emission reduction | GHG (Fuel + Electricity) Derivation | Total (thousand t) | 343.7 | 347.4 | 225.5 | 148.4 | ||
| Per Unit (kg/kL) | 72.9 | 71.9 | 44.0 | ||||||
| Reduction of energy consumption | Fuel | Crude oil conversion (thousand kL) | 104 | 102 | 111 | 11,150.7 | |||
| Per Unit (L/kL) | 22.1 | 21.2 | 21.8 | ||||||
| Electricity | Total amount (million kWh) | 340 | 352 | 383 | -1,012.2 | ||||
| Per Unit (kWh/kL) | 72.3 | 72.9 | 74.8 | ||||||
| Resource circulation | Reduction of water resource use | Water use | Total amount (thousand m3) | 20,752 | 20,461 | 21,230 | 1,024.1 | ||
| Per Unit (m3/kL) | 4.4 | 4.2 | 4.1 | ||||||
| Reduction of waste emissions | By-products and waste emissions | Total (t) | 228,355 | 209,683 | 229,207 | 3,897.0 | |||
| Per Unit (kg/kL) | 48.6 | 43.4 | 44.8 | ||||||
| Resource recycling rate | (%) | 100 | 100 | 100 | |||||
-
*Electricity based GHG emissions are the adjusted emission factors for each electric power company as specified by the Act on Promotion of Global Warming Countermeasures.
Economic effect of Suntory Group (production sites in Japan)
| Item | FY2020 | FY2021 | FY2022 |
|---|---|---|---|
| Income from recycling (sales of byproducts) | 305 | 326 | 333 |
| Cost saved by conserving energy | -242 | 150 | 731 |
Environmental Training
| Name | Target | Number of participating employees |
|---|---|---|
| Onboarding training (environmental management class) | New employees | All |
| ISO14001 awareness and special education | Plant employees | All |
| Sustainability management training (e-learning, etc.) | Group employees in Japan | 19,757 |
| Training for newly appointed employees in charge of ISO14001 | Employees in charge of ISO14001 | 17 |
| Internal ISO14001 auditor training | Internal ISO14001 auditor | 57 |
| Environmental Law Training | Employees from relevant departments | 49 |
| Wastes Disposal and Public Cleansing Act seminar | Employees from relevant departments | 411 |
Social Data
Employee Composition
| Employee Composition | 2021 | 2022 | 2023 | scope | ||
|---|---|---|---|---|---|---|
| Number of Suntory Group employees(people) | 40,275 | 40,885 | 41,511 | All Suntory Group companies | ||
| Suntory Group companies within Japan(people) | 18,671 | 18,923 | 19,330 | |||
| Suntory Group companies outside Japan(people) | 21,604 | 21,962 | 22,181 | |||
| Of which, employees of Suntory Holdings and Suntory Beverage & Food(people) | 7,291 | 7,385 | 7,723 | Suntory Holdings Limited and Suntory Beverage & Food Japan | ||
| Regular employees(people) | 6,997 | 7,078 | 7,411 | |||
| (Average age)(year ) | 43 | 43 | 43 | |||
| Executives(people) | 62 | 67 | 66 | |||
| Advisors(people) | 33 | 34 | 25 | |||
| Non-regular employees(contract employees, etc.)(people) | 158 | 166 | 184 | |||
| Other(athletes, etc.)(people) | 41 | 40 | 36 | |||
Employee Retention
| Employee Retention | 2021 | 2022 | 2023 | scope | |
|---|---|---|---|---|---|
| Number of new hires(people) | 146 | 209 | 270 | Suntory Holdings Limited and Suntory Beverage & Food Japan | |
| Number of recent graduates hired(people) | 113 | 114 | 168 | ||
| Number of mid-career hires(people) | 33 | 95 | 102 | ||
| Number of employees leaving the company(includes voluntary termination, retirement, death, and punitive dismissal)(people) | 186 | 200 | 212 | ||
| Of which, employees leaving the company voluntarily(people) | 56 | 56 | 62 | ||
| Employee turnover rate(%) | 0.8 | 0.8 | 0.9 | ||
| Percentage of new graduate hires who are still with the company after 5 years *1(%) | 90 | 90 | 88.2 | ||
| Average number of years of service(years) | 18.0 | 18.0 | 17.7 | ||
-
*1Calculated for new graduate hires (regular employees) of Suntory Holdings and Suntory Foods International from 2016 to 2018.
Career Development
| Career Development | 2021 | 2022 | 2023 | scope | |
|---|---|---|---|---|---|
| Number of employees submitting applications through the career development internal recruitment system*1(entry) | 191 | 249 | 226 | Suntory Holdings Limited and Suntory Beverage & Food Japan | |
| Number of employees whose applications were approved(people) | 31 | 36 | 31 | ||
| Career Vision interview*2 implementation rate (%) | 98.1 | 97.2 | 97.4 | ||
| Career Vision: Motivation in current position (out of 5)(point) | 4.1 | 4.1 | 4.13 | ||
| Career Vision: Satisfaction with current position (out of 5)(point) | 3.8 | 3.8 | 3.8 | ||
| Number of employees holding other positions concurrently(people) | 94 | 139 | 136 | ||
| Number of employees submitting entries to the “Walk the Walk—Yatte Minahare Award”*3(entry) | 300 | 483 | 482 | All Suntory Group companies | |
| Number of employees joining the FRONTIER DOJO internal entrepreneurship project*4(entry) | 294 | 97 | 105 | Suntory Group companies with in Japan | |
| Number of employees attending the Career Workshop*5 | |||||
| 3rd year(2022~)/4th year(~2021)after joining the company*6(people) | 129 | 303 | 127 | Suntory Holdings Limited and Suntory Beverage & Food Japan | |
| 10th year after joining the company(people) | 298 | 121 | 160 | ||
| 40s (including the compulsory workshop at the age of 43 [instituted in 2021] and other workshops for which participation is voluntary)(people) | 230 | 253 | 288 | ||
| 50s (including the compulsory workshop at the age of 58 and other workshops for which participation is voluntary)(people) | 243 | 191 | 181 | ||
| Number of career support interviews held by the Career Development Center (interview) | 888 | 1,409 | 1,929 | ||
-
*1This is an initiative that contributes to the growth of individual businesses and the personal growth of employees by cultivating new capabilities in a manner which is free from preconceived ideas.
-
*2Career Vision interviews are held for each employee once a year, to provide an opportunity for employees to think about their career through discussion with a manager, with the aim of “fostering the growth of individual employees through self-directed career development, and ensuring the effective utilization of human talent, including making sure that the right people are in the right positions.”
-
*3The “Walk the Walk—Yatte Minahare Award” is presented to teams that embody the “Yatte Minahare” spirit through the undertaking of original activities that challenge preconceptions and conventional methods.
-
*4In-house venture project started in 2021 to generate innovation and create the Suntory of the future
-
*5The Career Workshop is implemented in milestone years to provide an opportunity, in the form of a workshop, for employees to think about their careers, with the aim of “Enhancing career development over the medium to long term, and promoting more self-directed career management.”
Learning
| Learning | 2021 | 2022 | 2023 | scope | ||
|---|---|---|---|---|---|---|
| Training expenditure per employee per year(yen) | - | 301,000 | 368,000 | Suntory Holdings Limited and Suntory Beverage & Food Japan | ||
| Suntory Self-Development Program | ||||||
| Number of employees participating in voluntary training(people) | 848 | 3,810 | 2,757 | Suntory Holdings Limited and Suntory Beverage & Food Japan | ||
| Number of employees undertaking e-learning(people) | 775 | 1,015 | 1,042 | |||
| Total number of participants in the Terakoya program*1 (people) | 32,196 | 27,465 | 29,524 | Suntory Group companies with in Japan | ||
| Number of employees participating in global talent cultivation initiatives | ||||||
| Global Leadership Forum(people) | 16 | 15 | 21 | All Suntory Group companies | ||
| Suntory Harvard Program(people) | - | 31 | 20 | |||
| Beyond Borders(people) | 25 | 26 | 26 | |||
| Global Leadership Development Program(people) | 26 | 29 | 50 | |||
| Ambassador Program(people) | 39 | 26 | - | Suntory Group companies outside Japan | ||
| Total number of trainees successfully completing the program(people) | 23 | 21 | 26 | Suntory Holdings Limited and Suntory Beverage & Food Japan | ||
| Number of users of the School of Global Studies (opening in 2022)(people) | - | 2,313 | 3,650 | Suntory Group companies with in Japan | ||
-
*1A learning platform based on the concepts of "learning," "connecting," and "teaching each other" to foster a culture of more proactive learning
Diversity
| Gender | 2021 | 2022 | 2023 | scope | |
|---|---|---|---|---|---|
| Percentage of new hires that are female(%) | 37.0 | 48.0 | 49.6 | Suntory Holdings Limited and Suntory Beverage & Food Japan | |
| Percentage of female employees (%) | 25.5 | 26.2 | 27.6 | ||
| Percentage of female employees by age group | |||||
| 20s(%) | 42.6 | 42.6 | 44.9 | Suntory Holdings Limited and Suntory Beverage & Food Japan | |
| 30s(%) | 29.2 | 30.7 | 32.1 | ||
| 40s(%) | 21.1 | 21.8 | 23.0 | ||
| 50s(%) | 20.4 | 20.7 | 20.6 | ||
| 60s(%) | 13.1 | 15.6 | 16.8 | ||
| Number of female managers(people) | 196 | 197 | 215 | Suntory Holdings Limited and Suntory Beverage & Food Japan | |
| Percentage of female managers(%) | 11.2 | 11.1 | 11.8 | ||
| Number of female Executives(people) | 4 | 4 | 7 | ||
| Percentage of female Executives(%) | 6.5 | 6.0 | 10.6 | ||
| Female employees' salary as a percentage of male employees' salary*1 | |||||
| All employees(%) | 72.4 | 72.1 | Suntory Holdings Limited and Suntory Beverage & Food Japan | ||
| Of which, regular employees(%) | 72.9 | 72.4 | |||
| Of which, non-regular employees(%) | 41.5 | 52.8 | |||
-
*Includes athletes employed by Suntory Holdings Limited.
| Balancing work responsibilities with childcare and nursing care responsibilities | 2021 | 2022 | 2023 | scope | ||
|---|---|---|---|---|---|---|
| Number of female employees taking childcare leave(people) | 102 | 104 | 104 | Suntory Holdings Limited and Suntory Beverage & Food Japan | ||
| Percentage of employees taking childcare leave(%) | 105.2 | 108.3 | 96.3 | |||
| Number of male employees taking childcare leave(people) | 134 | 154 | 205 | |||
| Percentage of employees taking childcare leave(%) | 58.3 | 79.8 | 98.1 | |||
| Number of employees registering with the Job Return program in the current year(people) | 14 | 11 | 6 | |||
| Number of employees taking nursing care leave(people) | 2 | 0 | 2 | |||
| Number of employees making use of company-arranged home help services(people) | 4 | 3 | 0 | |||
| Senior employees | 2021 | 2022 | 2023 | scope | ||
|---|---|---|---|---|---|---|
| Number of employees re-employed by the company at the age of 65(people) | 37 | 39 | 36 | Suntory Holdings Limited and Suntory Beverage & Food Japan | ||
| Percentage of employees re-employed by the company at the age of 65(%) | 37 | 40 | 39 | |||
| Disability | 2021 | 2022 | 2023 | scope | ||
|---|---|---|---|---|---|---|
| Number of employees who have a disability(people) | 108 | 105 | 117 | Suntory Holdings Limited | ||
| Percentage of employees who have a disability(%) | 3.07 | 3.04 | 2.97 | |||
| Number of employees who have a disability(people) | 41 | 41 | 41 | Suntory Beverage & Food Japan | ||
| Percentage of employees who have a disability(%) | 2.69 | 2.65 | 2.69 | |||
Workstyles
| Workstyles | 2021 | 2022 | 2023 | scope | |
|---|---|---|---|---|---|
| Average number of days of annual paid leave taken*1(day) | 17.1 | 17.6 | 17.6 | Suntory Holdings Limited and Suntory Beverage & Food Japan | |
| Average overtime hours worked per month(hour) | 18.5 | 18.7 | 19.2 | Suntory Group companies with in Japan*2 | |
-
*1Encourage all employees to take at least 16 days of paid leave per year
-
*2Includes Suntory Holdings Ltd., Suntory Beverage & Food Ltd., Suntory Spirits Ltd., Suntory Products Ltd., Suntory Foods Ltd., Suntory Business Systems Ltd., Suntory Wellness Ltd., Suntory Global Innovation Center Ltd., and, Suntory System Technology Ltd.
Occupational Safety
| Occupational Safety | 2021 | 2022 | 2023 | scope | |
|---|---|---|---|---|---|
| Occupational accident severity rate (%) | 0.000 | 0.000 | 0.001 | Suntory Group companies with in Japan*1 | |
| Lost time incident rate (LTIR) (incidents per million working hours)(%) | 0.07 | ★0.14 | 0.21 | ||
| Number of employees undergoing occupational health and safety education(people) | 717 | 712 | 656 | ||
| Total annual hours worked per employee(hour) | 1,874 | 1,869 | 1,921 | ||
| Deaths due to occupational accidents(people) | 0 | 0 | 0 | Suntory Holdings Limited and Suntory Beverage & Food Japan | |
-
*1Occupational accidents involving full-time employees, special contract employees and part-time employees working at the following Suntory Group companies are included: Suntory Holdings Ltd., Suntrory Beverage & Food Group, (Suntory Beverage & Food Ltd., Suntory Foods Ltd., Suntory Products Ltd.), Suntory Spirits Ltd., Suntory Wellness Ltd., Suntory Business Systems Ltd. and Suntory Global Innovation Center Ltd.
-
*Results have received independent assurance from KPMG AZSA Sustainability Co., Ltd. The assured value is indicated with ★.
Labor Practices
| Labor Practices | 2021 | 2022 | 2023 | scope | |
|---|---|---|---|---|---|
| Percentage of employees with the legal right to engage in collective bargaining(%) | 55.8 | 54.5 | 52.5 | Suntory Holdings Limited and Suntory Beverage & Food Japan | |
Health
| Health | 2021 | 2022 | 2023 | scope | |
|---|---|---|---|---|---|
| Percentage of employees having a health examination(%) | 99.4 | 100.0 | 100.0 | Suntory Group companies with in Japan*3 | |
| Percentage of employees having a further examination or in-depth examination(%) | 74.1 | 83 | 91.1 | ||
| Percentage of employees eligible for specific health guidelines(%) | 21.4 | 21.4 | 21.4 | ||
| Percentage of smokers who are non-smokers or currently quitting smoking(%) | 82.7 | 83.5 | 83.1 | ||
| Percentage of employees having stress checks(%) | 94.8 | 90.5 | 90.5 | ||
| Percentage of employees found not to have high stress levels(%) | 93.0 | 91.8 | 91.9 | ||
| Presenteeism*1(%) | 79.2 | 79.1 | 79.8 | ||
| Absenteeism (number of days absence due to injury or illness)*2(day) | 0.5 | 0.7 | 0.7 | ||
-
*1Work productivity (4-week average), with 100% representing no injuries or illness.
-
*2Number of days on which employees are unable to work due to feeling unwell (3-month average)
-
*3Includes Suntory Holdings Ltd., Suntory Beverage & Food Ltd., Suntory Spirits Ltd., Suntory Products Ltd., Suntory Foods Ltd., Suntory Business Systems Ltd., Suntory Wellness Ltd., Suntory Global Innovation Center Ltd., and, Suntory System Technology Ltd.
Engagement
| Engagement | 2021 | 2022 | 2023 | scope | |
|---|---|---|---|---|---|
| Engagement Survey response rate(%) | 97.0 | 96.0 | 96.0 | Suntory Group companies with in Japan*1 | |
| Percentage of Favorable Respondents Regarding Pride in Working for the Suntory Group(%) | 85 | 82 | 85 | ||
| Proud to work for Suntory Group (out of 100)(point) | 81 | 79 | 81 | ||
| Percentage of favorable respondents regarding satisfaction with company (company they work for)(%) | 76 | 73 | 69 | ||
| Satisfaction with company (company you work for) (out of 100)(point) | 73 | 72 | 70 | ||
-
*1Includes Suntory Holdings Ltd., Suntory Beverage & Food Ltd., Suntory Spirits Ltd., Suntory Products Ltd., Suntory Foods Ltd., Suntory Business Systems Ltd., Suntory Wellness Ltd., Suntory Global Innovation Center Ltd., and, Suntory System Technology Ltd.
Overseas Data To be updated at the end of July
Employee Number (Y2022)
| Region - Employee number | 40,885 | |
| Japan(people) | 18,923 | |
| Americas(people) | 7,144 | |
| Europe(people) | 5,161 | |
| Asia, Oceania(people) | 9,657 | |
| Business - Employee number | 40,885 | |
| Beverages & Food(people) | 23,485 | |
| Liquor(people) | 9,763 | |
| Others(people) | 6,424 | |
| Corporate (common)(people) | 1,213 | |
Gender Ratio (Y2022)
| Suntory Beverage & Food (APAC) | Suntory Beverage & Food(Europe) | Beam Suntory Inc. | Suntory Japan* | ||
|---|---|---|---|---|---|
| Percentage of new hires that are female(%) | 42 | 48 | 42 | 48 | |
| Percentage of female employees(%) | 33 | 35 | 38 | 26 | |
| Average age of male employee(years) | 37 | 45 | 42 | 44 | |
| Average age of female employee(years) | 37 | 41 | 40 | 40 | |
| Average age of Executives(years) | 56 | 53 | 55 | 60 | |
| Percentage of female managers(%) | 33 | 35 | 43 | 11 | |
| Percentage of female Executives(%) | 8 | 36 | 17 | 6 | |
| Average number of years of service for female(years) | 8 | 8 | 7.5 | 19.4 | |
| Average number of years of service for male(years) | 8 | 11 | 6 | 14.2 | |
-
*People based in Suntory Holdings Limited and Suntory Beverage & Food Japan.
Engagement (Y2022)
| Suntory Beverage & Food (APAC)** | Suntory Beverage & Food(Europe) | Beam Suntory Inc. | Suntory Japan*** | ||
|---|---|---|---|---|---|
| Engagement Survey score(point) | 80 | 91 | 89 | 72 | |
-
**Suntory Beverage & Food (APAC) Score is 2021 result as Engagement Survey was not conducted in 2022.
-
***People based in Suntory Holdings Limited, Suntory Beverage & Food Japan, Suntory Spirits Ltd., Suntory Products Limited, Suntory Foods Limited, Suntory Business Systems Ltd., Suntory Wellness Ltd., Suntory Global Innovation Center Ltd. and Suntory System Technology Ltd.